
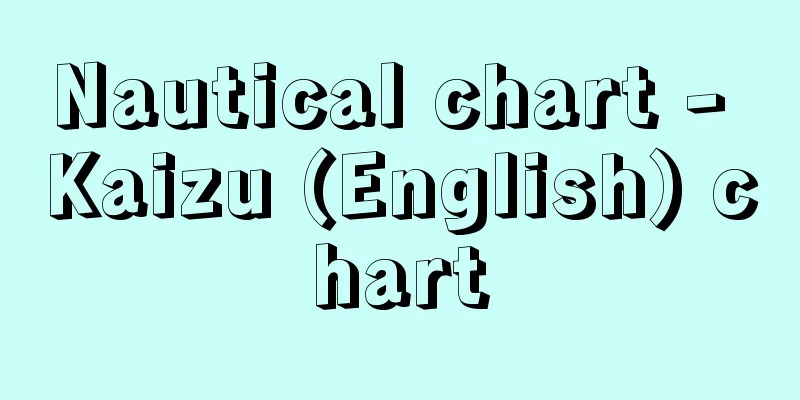
Nautical chart - Kaizu (English) chart
|
A thematic chart created for navigation that accurately and easily depicts the conditions of a waterway, such as water depth, bottom quality, coastal topography, dangerous objects, and navigational aids, which are necessary for navigation. Since the mid-1990s, electronic charts have appeared in addition to paper charts. [Takahiro Sato and Tadahiko Katsura] historyNautical charts were born out of the need for navigation, and developed in 13th century Europe when the compass was introduced from China, along with advances in navigation technology. Nautical charts at that time were called portolano charts, and had numerous direction lines from the compass written on them. During the Age of Discovery from the 15th century onwards, as sea routes were developed, the depth of the ocean began to be recorded, and the Mercator projection was used as a projection method. In Japan, Western countries surveyed the areas around ports of call and created nautical charts at the end of the Edo period. The shogunate also began surveying the waters around Japan in 1862 (Bunkyu 2), but it was not until the Meiji period that full-scale production of nautical charts began. In 1870 (Meiji 3), under the guidance of a British survey ship, surveys were carried out of Matoya Bay and Owase Bay in Mie Prefecture and the Shiwaku Islands in Kagawa Prefecture, and the following year in 1871, the Navy Hydrographic Bureau was established and surveyed the ports of Hokkaido, Miyako Bay and Kamaishi Bay in Iwate Prefecture. The nautical chart of Kamaishi Bay, "A Map of the Port of Kamaishi in Rikugoku," became the first nautical chart in Japan. [Takahiro Sato and Tadahiko Katsura] Contents of the chartNautical charts are made for navigation, so every detail is designed to make them easy to use for navigation. That is, the datum for water depth is different from the datum for height on land charts (the mean sea level of Tokyo Bay); tidal observations are conducted for each area, and the surface beyond which the sea level does not drop is determined, and this surface is designated as 0 meters. In Japan, the lowest water level is the datum for charts. The projection method is the Mercator projection. With this projection, the latitude and longitude lines are perpendicular straight lines, and if you sail while maintaining a constant direction, your ship's wake will be a straight line, and the angle on the chart between the ship's wake and the meridian is equal to the azimuth angle, making it extremely convenient for navigation. Depth is expressed by entering depth figures, and some contour lines are written in as they are used as a supplement. In the past, soundings were done with weights and ropes, so it was considered safer to show only the depth figures and for navigators to navigate with a generous draft while taking their own soundings, rather than drawing contour lines based on estimates outside of sounding points. Nowadays, echo sounders are used to ensure that no area is left unmeasured, but the method of representation remains the same. The countless depth values obtained by echo soundings are selected with an emphasis on making the chart easy to read and accurately depicting the topography. It is an international custom to draw contour lines so that the same depth value as the contour line is not written on the deeper side of the contour line. In other words, shallow areas are exaggerated for the safety of ships. The rule for land is to draw what can be seen from the sea, omitting the backs of tall mountains and drawing prominent landmarks such as chimneys, towers, buildings, and lighthouses near the coast. [Takahiro Sato and Tadahiko Katsura] kindsNautical charts are divided into general charts for navigation planning (scale smaller than 1:4 million), navigational charts for ocean navigation (scales between 1:4 million and 1: million), navigational charts for land areas (scales between 1: million and 1:300,000), coastal charts for coastal areas (scales between 1:300,000 and 1:50,000), and harbor charts for harbors (scales larger than 1:50,000), and the details are abbreviated according to their purpose. These charts are not continuous charts with grid divisions like land charts, but have various scales and included areas. This is because there is overlap between charts of the same scale for the convenience of recording the ship's position when changing charts during a voyage, and the included area and scale are also changed appropriately according to the land topography, and consideration is given to including from cape to cape, or prominent landmarks and dangerous shallows on one chart. In the narrow sense, nautical charts refer to navigational charts such as general charts, navigational charts, navigational charts, coastal charts, and harbor charts, but in the broader sense, they also include special charts. Special charts are navigational reference charts with content different from that of nautical charts, and include great circle charts (maps for determining the shortest route between two points on Earth), pilot charts (special waterway charts that contain information necessary for the safe and economical navigation of ships, such as weather, sea conditions, great circle routes, and trade wind limits), ocean current charts, tidal charts, position charts, fishing gear placement locations charts, magnetic charts, and others. Meanwhile, in the mid-1990s, electronic charts appeared, which show chart information on a display. An electronic chart is defined as a combination of software such as a chart database and hardware such as an electronic chart display system. An electronic navigational chart (ENC) is a chart database that digitizes chart information necessary for safe navigation according to internationally determined technical standards. By using this in an electronic chart display system (ECDIS) installed on the bridge, it can be used for ship navigation as the equivalent of a (paper) chart. The Hydrographic Department (now the Marine Information Department) of the Japan Coast Guard has been developing an electronic chart production system since 1992, and since 1998 has been publishing the latest small-scale electronic charts, Edition 4, which cover Japan and its surrounding waters, and large-scale electronic charts, Edition 11, which cover major port areas. [Takahiro Sato and Tadahiko Katsura] International OrganizationsNautical charts are used not only by Japanese ships but also by foreign ships on international voyages, so they are made according to internationally standardized formats (symbols and abbreviations) and have English text written on them. One feature that distinguishes nautical charts from land charts is that they are kept up to date. Since the invisible conditions of the seabed can only be known by relying on nautical charts, changes in the coast and seabed are constantly surveyed, and nautical charts are revised based on the weekly publication of Notices to Mariners and Electronic Notices to Mariners (CD-ROM), and dangerous shallow areas and sunken ships are notified as needed through radio navigation warnings. Japan's nautical charts are published mainly covering the area surrounding Japan, including the Pacific and Indian Oceans, while the UK, USA, France and Russia publish charts covering the entire world, Germany covers Europe and the Atlantic Ocean, and other countries publish charts covering their own countries. The chart-making organizations of these countries are members of the International Hydrographic Organization (IHO), which promotes the development of hydrographic services and international cooperation, and has its permanent secretariat in Monaco. [Takahiro Sato and Tadahiko Katsura] "Maps of the Sea, by Kawakami Kiyoshi (1974, Asakura Publishing)" ▽ "How to Read Nautical Charts, by Kutsuna Kageyoshi and Sakado Naoki (1989, published by Kajakusha and Tennensha)" ▽ "Making Nautical Charts, by Sugiura Kunio (1996, published by the Transportation Research Association and Seizando Bookstore)" ▽ "New Edition of Knowledge of Nautical Charts, by Kutsuna Kageyoshi and Sakado Naoki (1996, published by Seizando Bookstore)" [References] | | | |Source: Shogakukan Encyclopedia Nipponica About Encyclopedia Nipponica Information | Legend |
|
航海のためにつくられた主題図で、航海上必要な水深、底質、海岸地形、危険物、航路標識など水路の状況を正確かつ見やすく表現した図。1990年代中ごろより紙海図のほか電子海図も現れた。 [佐藤任弘・桂 忠彦] 歴史海図は航海の必要から生まれたもので、羅針盤が中国からもたらされた13世紀のヨーロッパで、航海技術の進歩とともに発達した。当時の海図はポルトラノといわれる図で、羅針盤からの多数の方位線が記入されている。15世紀以降の大航海時代には航路の開拓とともに、海の深さを記入するようになり、投影法もメルカトル図法が用いられた。日本では幕末に欧米諸国が寄港地付近を測量し海図をつくっていた。幕府も1862年(文久2)に日本近海の測量を始めたが、本格的な海図の作成は明治時代になる。1870年(明治3)イギリス測量船の指導を受け、三重県の的矢(まとや)湾と尾鷲(おわせ)湾、香川県の塩飽(しわく)諸島の測量が行われ、翌1871年には海軍水路局が創設され、北海道の諸港湾、岩手県の宮古(みやこ)湾と釜石(かまいし)湾が測量された。釜石湾の海図「陸中国釜石港之図」は日本の海図第一号となった。 [佐藤任弘・桂 忠彦] 海図の内容海図は航海のためにつくられるので、細部について、航海に使いやすく配慮されている。すなわち、水深の基準面は陸図の高さの基準面(東京湾平均海面)と異なり、各地ごとに潮汐(ちょうせき)観測を行い、これ以上海面が下がることがない面を定め、これを0メートルとしている。日本では最低水面が海図基準面である。投影法はメルカトル図法による。この図法では経緯線は直交する直線となり、また一定の方位を保って航走すれば、航跡は直線となり、航跡線と子午線のなす図上の角度は方位角と等しくなるので、航海上きわめて便利である。深さの表現は水深数字を記入し、等深線は補助的に使用されるために一部記されている。 昔はおもりとロープによる測深であったから、測深地点以外を推定によって等深線で描くよりは水深数字のみを示し、航海者は自ら測深しつつ喫水(きっすい)に余裕をもって航海するのが安全であると考えられていた。現在は音響測深機が用いられ、未測区域がないように測深されているが、表現法は変わらない。音響測深により無数に得られる水深値の取捨選択は、図を見やすくし、しかも地形を的確に表現することに重点をおいてなされる。等深線は、等深線と同一の水深値が等深線の深い側に記入されないように描くのが国際的な習慣である。つまり船舶の安全のために浅所を誇張表現するわけである。陸部も、海上から見えるものを描くのが原則で、高い山の背後は省略し、海岸付近の煙突、塔、建物、灯台など顕著な目標を描いてある。 [佐藤任弘・桂 忠彦] 種類海図は航海計画用の総図(400万分の1より小縮尺)、大洋航海用の航洋図(400万~100万分の1)、陸地付近の航海図(100万~30万分の1)、沿岸用の海岸図(30万~5万分の1)、港内用の港泊図(5万分の1より大縮尺)に分けられ、それぞれの目的によって表現も省略されていく。これらの海図は、陸図のように格子状の区分をもつ連続図ではなく、縮尺、包含区域はさまざまである。これは、航海中に図を取り替えるときの船位記入の便のために同縮尺の図の間でも重複部分をとっているためであり、また包含区域と縮尺は陸地地形により適宜に変え、岬から岬まで、あるいは顕著な目標や危険な浅所を一図の中に含めるという配慮のためでもある。 狭義の海図は総図、航洋図、航海図、海岸図、港泊図の航海用海図をいうが、広義には特殊図も含める。特殊図は海図とは別の内容をもつ航海参考用図で、大圏航法図(地球上の2地点間の最短航路を求めるための地図)、パイロットチャート(船の安全かつ経済的航行のために必要な、気象・海象・大圏航路・貿易風の限界などの情報が記載されている水路特殊図)、海流図、潮流図、位置記入用図、漁具定置箇所一覧図、磁気図、その他がある。 一方、1990年代中ごろになってディスプレー上に海図情報を表示する電子海図が登場した。電子海図とは海図データベースなどのソフトウェアとハードウェアである電子海図表示システムをあわせたものと規定される。航海用電子海図(ENC)は航海安全に必要な海図情報を国際的に決められた技術基準により電子化した海図データベースである。これを船橋に装備された電子海図表示システム(ECDIS)で使用することにより(紙)海図同等物として船の運航に利用される。 海上保安庁水路部(現海洋情報部)は1992年(平成4)から電子海図作成システムを整備し、1998年から日本およびその周辺海域を包含する最新の小縮尺電子海図4版と主要港湾域を包含する大縮尺電子海図11版を刊行している。 [佐藤任弘・桂 忠彦] 国際機関海図は日本船舶だけでなく、国際航海をする外国船舶も使うので、国際的に統一された図式(記号や略語)に従ってつくられ、英文を併記してある。海図が陸図と違う特徴の一つは最新図を維持することである。目に見えない海底の状況は海図に頼るほかないので、海岸や海底の変化に対してはつねに測量し、毎週公表される水路通報や電子水路通報(CD-ROM)で海図を修正し、危険な浅所や沈船などは随時、無線航行警報によって周知を図っている。 日本の海図は、日本周辺地域を中心に太平洋、インド洋を包含して刊行され、イギリス、アメリカ、フランス、ロシアは全世界について、ドイツはヨーロッパ、大西洋を、その他の国は自国周辺を刊行範囲としている。これら世界各国の海図作成機関は国際水路機関(IHO)に加盟し、水路業務の発展と国際的協力を図っており、モナコにはその恒久的な事務局が置かれている。 [佐藤任弘・桂 忠彦] 『川上喜代四著『海の地図――航海用海図から海底地形図まで』(1974・朝倉書店)』▽『沓名景義・坂戸直輝著『海図の読み方』新版(1989・舵社、天然社発売)』▽『杉浦邦朗著『海図をつくる』(1996・交通研究協会、成山堂書店発売)』▽『沓名景義・坂戸直輝著『新訂 海図の知識』改訂版(1996・成山堂書店)』 [参照項目] | | | |出典 小学館 日本大百科全書(ニッポニカ)日本大百科全書(ニッポニカ)について 情報 | 凡例 |
<<: Sea water - Kaisui (English spelling)
>>: Foreign Legion (English: Légion Étrangère, French)


Recommend
Goetze, A.
…Hittite was discovered to be a branch of the Ind...
Itagaki Taisuke - Itagaki Taisuke
A Meiji politician. Born on April 17, Tempo 8, in...
Brown rice - Genmai
This refers to unpolished rice with only the husk...
Radio wave fee - denparyou
The fee that commercial broadcasters receive from...
Begriff
...As is clear from the fact that the etymology o...
Newspaper Business Act
Imperial Ordinance No. 1107 of 1941. This is a reg...
Asuka Art
There are differing theories regarding the divisio...
Gnathostoma spinigerum
… [Shomei Kojima]. … *Some of the terminology tha...
Constitutional Party - Rikkenseito
A political party during the Liberal Democratic Pa...
Honjo Eijiro - Honjo Eijiro
Born: February 28, 1888 in Kyoto Died November 18,...
Gaultheria adenothrix (English spelling) Gaultheriaadenothrix
… [Kei Yamazaki]. … *Some of the terminology that...
Coffin birth - Kannaibunben
...As the decay progresses further, the body beco...
Gerhaert van Leyden, N.
...In the second half of the 14th century, the Pa...
Opioid peptides
A general term for a group of peptides that specif...
Buddha's name ceremony - Butsumyo-e
Also called Obutsu-myo (Buddha's name) or San...